

OHIO APPALACHIAN COLLABORATIVE
HIGH SCHOOL COMPARISONS
JANUARY 16, 2014
[REVISED FEBRUARY 5, 2014]
PREPARED BY SCOTT GERBER
GERBER ANALYTICS, LLC
The table below highlights the academic performance of the high schools in the Ohio Appalachian Collaborative. Included with the table are links that provide even greater insight and detail.
What Was Included?
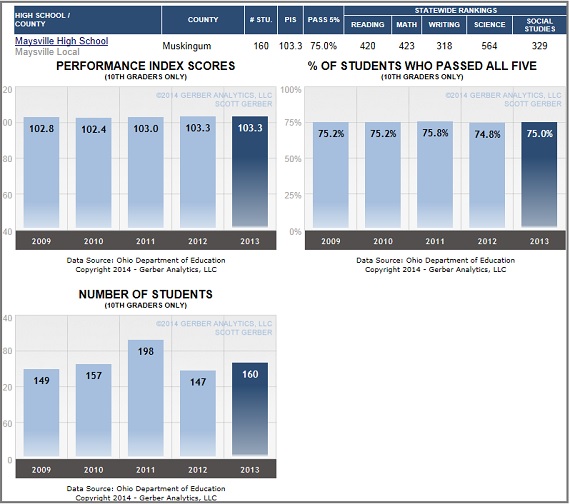
The table below uses the March 2012-2013 data from the Ohio Graduation Test for only the 10th graders who took the test. For those unfamiliar with the Ohio Graduation Test, there are five parts -- Reading, Mathematics, Writing, Science, and Social Studies. There is also a summary page that shows the percentage of students who successfully passed all five parts with a “Proficient” rating. The data used in this report is from those five parts and the summary.
There were 991 schools included in the rankings of public and private schools. The Ohio Department of Education (ODE) Local Report Card data download capability was used to acquire most of the data for the public schools. The ODE provided electronic media as the source for the private school data, the charter schools, and the "percentage of students who passed all five parts" of the test for all schools.
Rankings
To create the statewide rankings, the Performance Index Scores were calculated for each individual subject. The schools' subject Performance Index Scores were then sorted.
The subject rankings provide an additional dimension by helping to identify the strengths and weaknesses within each school. To view detailed performance on each school, click on the school name.
The table below is sorted so that schools are in Performance Index Scores order.
| HIGH SCHOOL / DISTRICT |
COUNTY |
# STU. |
PIS |
PASS 5% |
STATEWIDE RANKINGS |
||||
READING |
MATH |
WRITING |
SCIENCE |
SOCIAL STUDIES |
|||||
|
John Glenn High School East Muskingum Local |
Muskingum | 154 |
103.9 |
75.3%
|
311
|
431
|
252
|
354
|
476
|
|
Maysville High School Maysville Local |
Muskingum | 160 |
103.3 |
75.0%
|
420
|
423
|
319
|
564
|
329
|
|
West Muskingum High School West Muskingum Local |
Muskingum | 123 |
102.7 |
77.2%
|
496
|
495
|
650
|
459
|
217
|
|
Philo High School Franklin Local |
Muskingum | 166 |
102.5 |
72.9%
|
529
|
406
|
733
|
407
|
237
|
|
Waterford High School Wolf Creek Local |
Washington | 55 |
101.9 |
78.2%
|
627
|
514
|
296
|
484
|
523
|
|
South Webster Jr/Sr High School Bloom-Vernon Local |
Scioto | 63 |
101.6 |
69.8%
|
481
|
361
|
535
|
452
|
644
|
|
Miller High School Southern Local |
Perry | 50 |
101.5 |
72.0%
|
604
|
547
|
507
|
462
|
467
|
|
Sheridan High School Northern Local |
Perry | 197 |
101.4 |
70.1%
|
585
|
489
|
755
|
487
|
315
|
|
Warren High School Warren Local |
Washington | 173 |
100.8 |
70.5%
|
597
|
616
|
527
|
502
|
507
|
|
River View High School River View Local |
Coshocton | 162 |
100.7 |
69.8%
|
693
|
458
|
589
|
540
|
511
|
|
Shenandoah High School Noble Local |
Noble | 81 |
100.5 |
70.4%
|
547
|
507
|
446
|
635
|
621
|
|
Morgan High School Morgan Local |
Morgan | 124 |
99.4 |
69.4%
|
683
|
556
|
705
|
516
|
611
|
|
Coshocton High School Coshocton City |
Coshocton | 113 |
99.3 |
68.1%
|
690
|
705
|
653
|
624
|
395
|
|
Belpre High School Belpre City |
Washington | 86 |
99.1 |
67.4%
|
551
|
725
|
420
|
700
|
574
|
| HIGH SCHOOL / COUNTY |
COUNTY |
# STU. |
PIS |
PASS 5% |
STATEWIDE RANKINGS |
||||
READING |
MATH |
WRITING |
SCIENCE |
SOCIAL STUDIES |
|||||
|
Marietta High School Marietta City |
Washington | 235 |
98.3 |
66.4%
|
602
|
674
|
762
|
556
|
657
|
|
Batavia High School Batavia Local |
Clermont | 164 |
98.3 |
65.2%
|
586
|
684
|
693
|
664
|
641
|
|
Georgetown Jr/Sr High School Georgetown Exempted Village |
Brown | 73 |
95.6 |
61.6%
|
719
|
730
|
828
|
642
|
729
|
|
Meadowbrook High School Rolling Hills Local |
Guernsey | 157 |
94.6 |
58.6%
|
742
|
763
|
748
|
751
|
742
|
|
Glenwood High School New Boston Local |
Scioto | 38 |
90.1 |
50.0%
|
865
|
756
|
818
|
815
|
809
|
|
Crooksville High School Crooksville Exempted Village |
Perry | 100 |
90.0 |
46.0%
|
833
|
806
|
820
|
801
|
824
|
|
Franklin Local Community School Franklin Local |
Muskingum | 15 |
84.4 |
20.0%
|
844
|
810
|
906
|
856
|
893
|
Trend Charts for Performance Index Scores, % Who Passed all Five Tests, and # Taking Test
While the table above provides a good, static comparison among these schools, it does not provide readers with an "over time" perspective. Click on this link to see five year trend charts for each school's Performance Index Score, % Who Passed All Five Tests, and Number of Students who took the test.
 Click on this link to return to the table-only view.
Comparative Analysis
While the performance numbers and trend charts are beneficial, what sets this web site apart from others is the comparative analysis that this site permits with other schools and within schools.
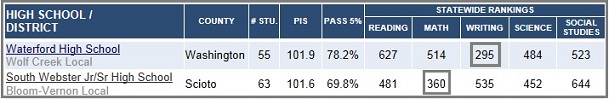 South Webster has done a nice job in Math. What can it do better in Reading, Writing, Science, and Social Studies? Why is Waterford so strong in Writing?
One of the goals for this web site is to encourage communities to become better informed and to ask questions. I believe these tools encourage this.
Corrections
Does this document include any mistakes? Hopefully not, the data was carefully entered and the numbers were double checked, but it is possible. Please send a Feedback message with any significant discrepancies. The revised document will be updated and placed online.
You may forward this report to anyone you wish but please give proper attribution if you use any of this material. To assist with tracking, please provide others with this link:
I have a substantial "one-of-a-kind" database, and I am open to new analysis projects. If you have an education-related analysis project in mind that you think would benefit all Ohio schools, please contact me.
Please let me know if you have any questions or comments.
Scott Gerber
Gerber Analytics, LLC
GerberAnalytics.com
Click to submit a Feedback for any questions and/or to have your email address included so that you may be alerted to additional analysis.
Calculation of Performance Index Score (Adjusted)
Note that the Performance Index Score (Adjusted) is different from what you may have seen on the Ohio Department of Education’s Report Card. The calculation in this document is only for the 10th grade students. It was calculated as follows:
Ada High School
Subject |
Below Basic | Basic | Proficient | Accelerated | Advanced |
|
| Mathematics | 9.4% | 9.4% | 24.5% | 20.8% | 35.8% | |
| Reading | 3.8% | 5.7% | 43.4% | 35.8% | 11.3% | |
| Science | 3.8% | 18.9% | 26.4% | 22.6% | 28.3% | |
| Social Studies | 15.1% | 9.4% | 24.5% | 22.6% | 28.3% | |
| Writing | 5.7% | 5.7% | 39.6% | 47.2% | 1.9% | |
| Total of Above | 37.7% | 49.1% | 158.5% | 149.1% | 105.7% | |
| Average of 5 | 7.5% | 9.8% | 31.7% | 29.8% | 21.1% | |
| Factor | 0.3 | 0.6 | 1 | 1.1 | 1.2 | |
| Summation | ||||||
| Average * Factor | 2.3 | 5.9 | 31.7 | 32.8 | 25.4 | 98 |
The new "Advanced Plus" designation was used randomly for some schools. To insure an "apples-to-apples" comparison, the percentage of students scoring "Advanced Plus" was added to the Advance category.
The February 5th revision includes the graph of the Number of Students who took the OGT test each year.