Western Brown High School
Academic Results
|
PERFORMANCE INDEX SCORES (10TH GRADERS ONLY)
|
|
Principal: Heather Cooper County: Brown ACT Results Available: Click to View |
Mathematics |
Reading
| Science |
Social Studies |
Writing |
Western Brown - Proficiency Levels by Subject (%) (10th Graders Only)
Mathematics |
Reading |
Science |
Social Studies |
Writing |
| Advanced | ||||
| Accelerated & Above | ||||
| Proficient & Above |
Percentage of Students Who Passed All Five Tests (10th Graders Only)
Number of Students Who Took the Test (10th Graders Only)
|
BOYS / GIRLS TAKING TEST IN 10TH GRADE
(10TH GRADERS ONLY) |
|||||||||
| Southern Buckeye Athletic/Academic Conference Comparisons |
Performance Index Score Comparisons for the 2013-14 School Year (10th Graders Only)
- Goshen
- New Richmond
- Williamsburg
- Bethel Tate
- Blanchester
- Western Brown
- Clermont Northeastern
- Batavia
- Georgetown
- East Clinton
- Felicity-Franklin
Data Source: Ohio Department of Education
Copyright 2024 - Gerber Analytics, LLC
Percentage of Students Who Passed All Five OGT Tests for the 2013-14
School Year (10th Graders Only)
- Goshen
- New Richmond
- Bethel Tate
- Blanchester
- Williamsburg
- Western Brown
- Clermont Northeastern
- East Clinton
- Batavia
- Felicity-Franklin
- Georgetown
Data Source: Ohio Department of Education
Copyright 2024 - Gerber Analytics, LLC
Statewide Ranking in Each Subject for the 2013-14 School Year (10th Graders Only)
| High School (Click for More Information) | County | Performance Index Score Rankings |
5 of 5 Passing Rate |
|||||
|---|---|---|---|---|---|---|---|---|
Overall |
Math |
Reading |
Science |
Soc.Stu. |
Writing |
|||
| Goshen | Clermont | 318 |
186
|
455
|
456
|
183
|
457
|
350 |
Williamsburg | Clermont | 356 |
428
|
302
|
444
|
415
|
150
|
506 |
| New Richmond | Clermont | 357 |
294
|
486
|
368
|
311
|
455
|
395 |
Bethel-Tate | Clermont | 450 |
367
|
368
|
449
|
517
|
557
|
397 |
| Blanchester | Clinton | 488 |
369
|
635
|
551
|
432
|
457
|
413 |
| Western Brown | Brown | 559 |
497
|
619
|
647
|
431
|
585
|
541 |
| Clermont Northeastern | Clermont | 609 |
578
|
658
|
481
|
552
|
732
|
552 |
Batavia | Clermont | 670 |
721
|
678
|
695
|
576
|
567
|
697 |
| Georgetown | Brown | 690 |
728
|
628
|
615
|
703
|
701
|
728 |
East Clinton | Clinton | 706 |
725
|
759
|
672
|
647
|
686
|
649 |
| Felicity-Franklin | Clermont | 788 |
723
|
868
|
762
|
823
|
799
|
705 |
| Previous Year (2013) Results for Western Brown | ||||||||
| Western Brown | Brown | 538 |
447
|
497
|
639
|
533
|
505
|
501 |
| 2012 Ranking Results for Western Brown | ||||||||
| Western Brown | Brown | 643 |
631
|
613
|
704
|
556
|
610
|
636 |
| Explanation: The above table can be confusing. As an example, Western Brown is ranked number 559 in Ohio in its overall Performance Index Score, but it performed better in Math (497) than it did in its overall score. Note that all subjects with rankings in blue italics performed better than the other subjects. The 10th grade teachers of those subjects (and those teachers in earlier grades) should be commended. To improve the overall rankings, the non-italicized subjects need to improve. This table is only based on the results for the 2013-2014 school year. More than one year of analysis should be used when evaluating teachers and programs, and in many cases, another year is provided above for most schools. | ||||||||
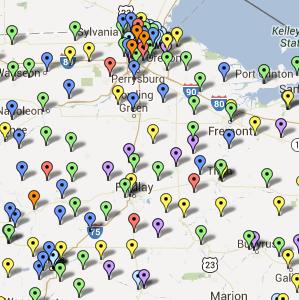
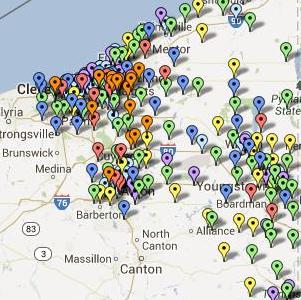
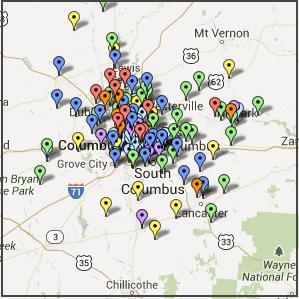
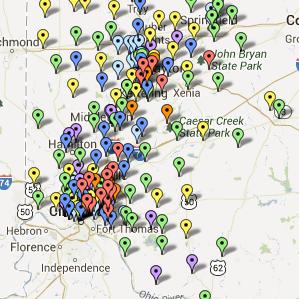
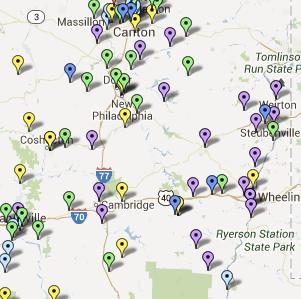
Performance Map of Western Brown and All Schools with 2012-2013 Data
Note: The Performance Maps are no longer available.
 |
 |
|
 |
||
 |
 |
|
| Click on an image to see a Google map of that area. | ||
This data is believed to be correct, but use it at your own risk. If you have any questions or comments, please contact Scott Gerber of Gerber Analytics, LLC via a Feedback message
Central Ohio tennis enthusiasts may click on the following link(s) for Western Brown tennis results from Gerber Analytics, LLC: Boys Girls
